FTIR Analysis of Coatings: What a Spectrum Can and Cannot Show
FTIR helps identify coating chemistry, compare samples, and investigate chemical changes. Learn how ATR and transmission differ, why sampling and reference materials matter, and where spectral interpretation reaches its limits.
Key takeaways
- FTIR helps identify coating chemistry and compare samples.
- The sampling method determines which surface, layer, or mixture is represented.
- A library match needs an analyst’s review and suitable reference materials.
- Quantification and cure assessment require a method developed for the coating being tested.
What does FTIR measure?
Fourier transform infrared spectroscopy (FTIR) measures how a material absorbs infrared radiation. The resulting spectrum contains bands associated with molecular vibrations, plotted against wavenumber, commonly in cm−1. Laboratories use these patterns to investigate chemical groups and compare materials. Shimadzu’s FTIR fundamentals explain the measurement principle.
For coatings, FTIR can help characterize binders, certain pigments and fillers, or foreign material. It can also investigate chemical changes during curing or exposure. Its usefulness depends on the question, the specimen, and the quality of the comparison.
ATR and transmission sample differently
Attenuated total reflectance (ATR) requires close contact between the specimen and an optical crystal. It examines a shallow region next to that contact surface. Penetration depends on wavenumber, incidence angle, and refractive indices; changing the crystal can change the contribution from underlying material. A surface measurement therefore cannot automatically describe an entire multilayer coating. Shimadzu’s ATR depth guidance explains these dependencies.
Transmission passes infrared light through a prepared specimen. A thin isolated film or a suitably prepared paint fragment may be appropriate. Thickness and preparation matter: strongly absorbing specimens can produce saturated bands and lose useful detail. Thermo Fisher’s transmission guide describes acquisition and interpretation.
Infrared microscopy can target small regions or individual layers. The laboratory should select the accessory and preparation around the investigation, rather than assuming every paint chip is suitable for direct ATR analysis.
Make the sample answer the question
An exposed topcoat, the underside of a detached flake, and a scraping containing several layers represent different material. Identify the face and location being examined. Compare suspect and apparently sound areas separately, and supply a known reference from the same product where possible. Record differences in age, curing, and exposure.
Surface deposits and sampling contamination can influence the spectrum. Roughness or poor crystal contact can also weaken or alter ATR results. Material may transfer onto the crystal and affect later measurements. Shimadzu’s microscopy guidance illustrates these contact and residue effects.
Ask the laboratory how to collect and package specimens before scraping or cleaning. Preserve an untreated portion when investigating contamination; cleaning may remove the material of interest.
Interpret matches and differences carefully
A library search ranks spectral similarities. The highest-scoring result still needs review against the observed bands, sample history, and plausible chemistry. Mixtures and modified polymers can complicate identification. Shimadzu’s library-search teaching note explains why the first hit may be unsuitable.
Use references collected with comparable methods. ATR and transmission can produce different relative band intensities; appropriate correction may improve comparison, but should be documented. Thermo Fisher’s ATR guide recommends attention to library quality and sampling technique.
Finding a binder family does not reconstruct the exact commercial formulation. Likewise, similar spectra do not establish identical application histories. Where interpretation remains ambiguous, report the uncertainty and use complementary analysis chosen for the unresolved question.
Can FTIR measure cure or concentration?
FTIR can track selected spectral changes during cure. Agilent’s coatings study examines individual epoxy and polyurethane systems through their curing histories. Those results depend on the products, measurement interface, and analytical model used.
A numerical concentration requires suitable calibration samples and control of interfering signals, as described in Thermo Fisher’s quantitative-analysis exercise. Similarly, a claimed percentage cure needs a defined chemical endpoint and a validated comparison for the formulation. A shrinking peak alone does not establish readiness for service. See cure testing for the wider assessment.
What should the report include?
- Sample identity, location, layer or face, and condition.
- Collection, preparation, cleaning, and storage details.
- Sampling mode, crystal where applicable, measurement settings, and processing.
- Reference materials, library sources, comparisons, and repeat measurements.
- Observed findings, interpretation limits, and any recommended additional tests.
Use a laboratory experienced in coatings and the relevant sampling technique. ASTM E2937-26 provides guidance for forensic paint examinations within a broader analytical scheme. It is not a universal industrial coating acceptance test.
Frequently asked questions
Does FTIR measure adhesion?
No. It supplies chemical information. Adhesion requires an appropriate mechanical test and interpretation of the failure location.
Can a clean-looking spectrum exclude contamination?
No. The sampled location, amount present, overlapping bands, and method sensitivity affect what can be detected.
Can one spectrum predict coating life?
No general service-life prediction follows from one spectrum. Exposure history, coating system, and independently established performance evidence remain necessary.
At a glance
- Method: Fourier transform infrared spectroscopy
- Typical questions: Chemistry, comparison, contamination, chemical change
- Common sampling modes: ATR and transmission
- Best comparison: Relevant reference measured under comparable conditions
- Main limitation: Conclusions apply to the sampled material and validated method
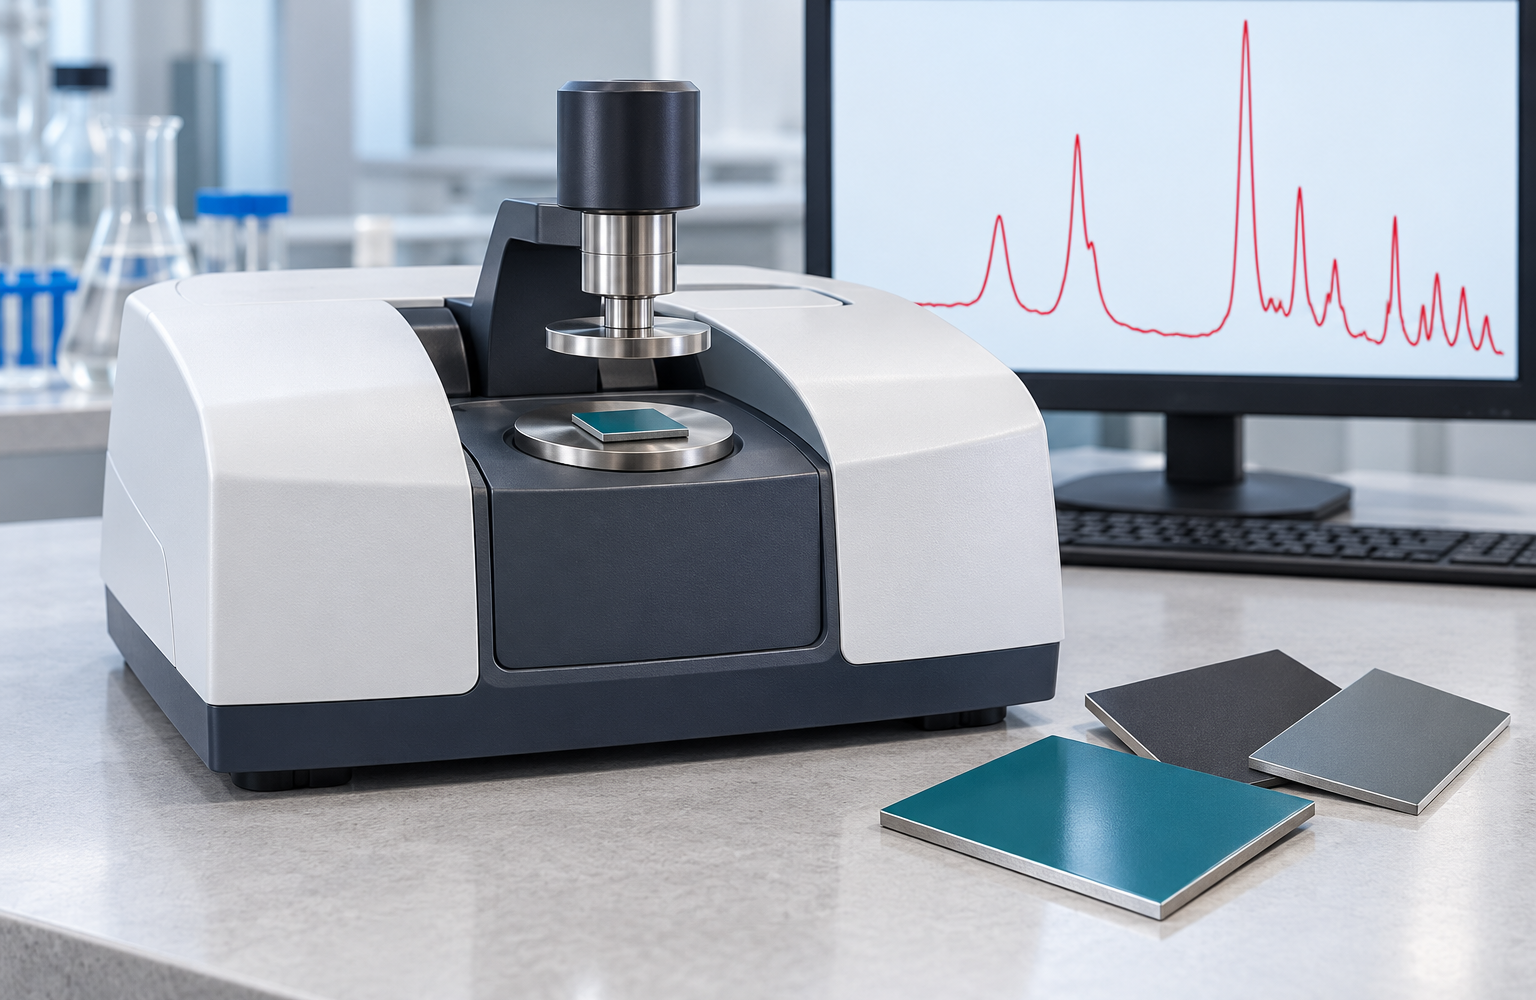
Educational reference. Use the applicable full method, laboratory guidance and project specification. Cover: original AI-generated illustration; the schematic spectrum does not represent a measured specimen.
Educational reference. Coating performance varies by formulation. Always follow the manufacturer’s product data sheet, safety data sheet and your project specification.