Electrochemical Impedance Spectroscopy (EIS) for Coatings
An introduction to EIS for coated metals: measurement arrangements, spectra, modeling limits and the information a useful test report should retain.
Key takeaways
- EIS measures a frequency-dependent response rather than a single coating property.
- Compare specimens using documented exposure conditions, geometry, and measurement settings.
- Equivalent-circuit parameters require a physically justified interpretation.
- Check measurement quality before drawing conclusions about coating performance.
What is EIS?
Electrochemical impedance spectroscopy (EIS) measures the relationship between an alternating electrical stimulus and the resulting response across a range of frequencies. In potentiostatic EIS, a small voltage perturbation is applied and the current is measured. The result includes both impedance magnitude and phase. Gamry’s EIS overview describes these measurement modes.
How coatings are measured
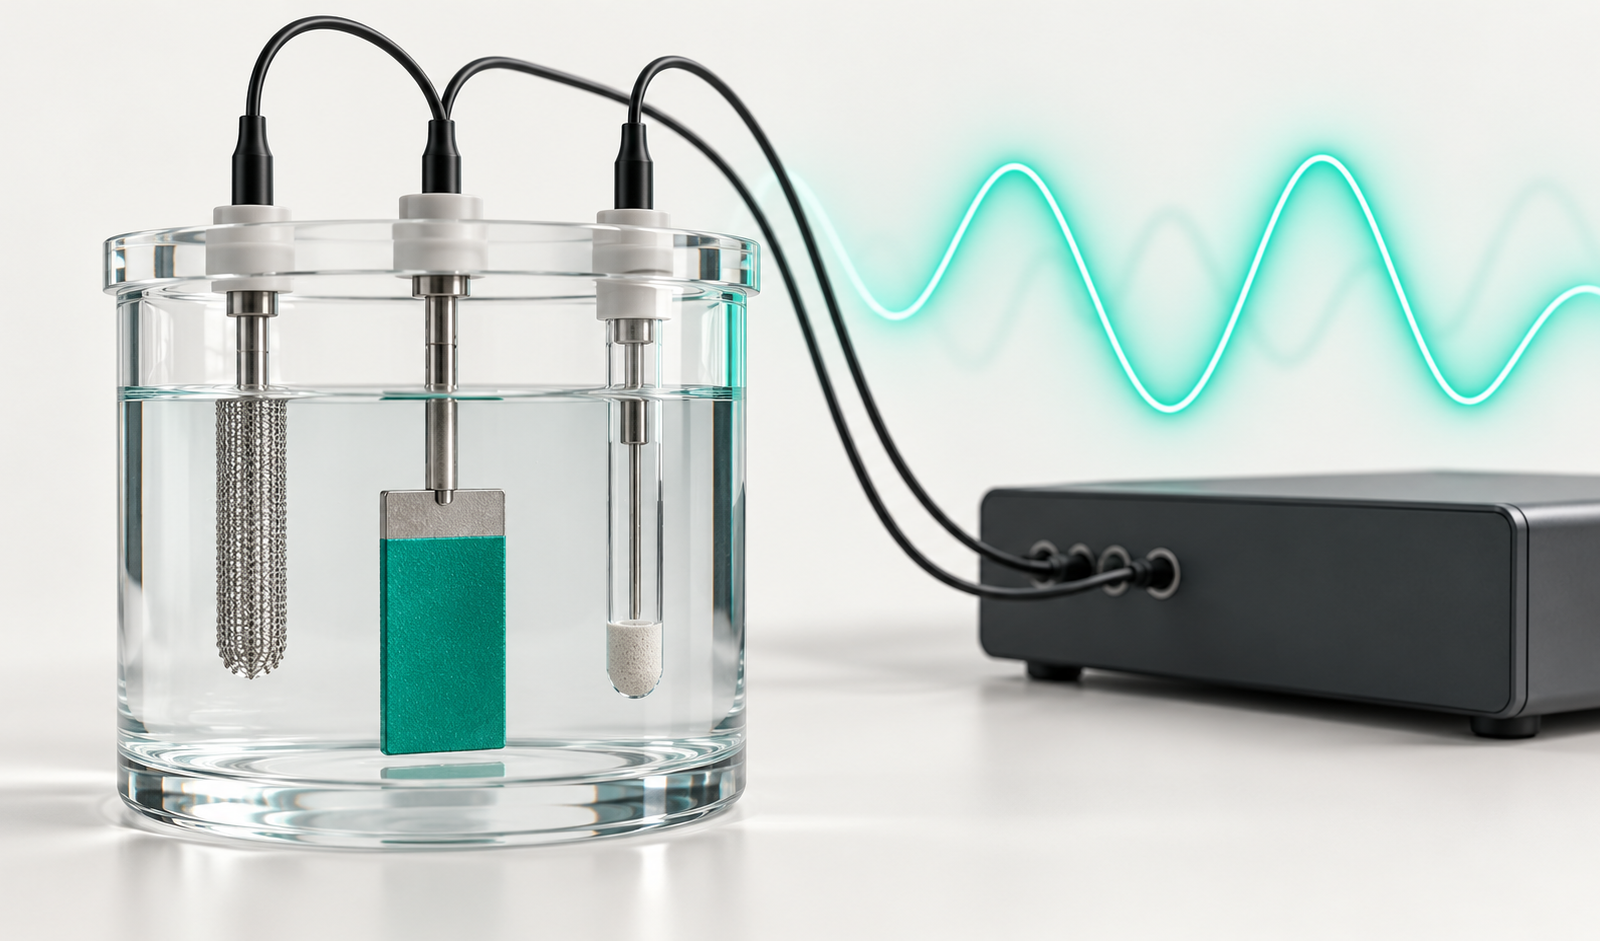
A common laboratory arrangement uses the coated metal as the working electrode, an electrolyte contacting a defined coating area, and separate reference and counter electrodes. A potentiostat with impedance capability controls the experiment. Frequency limits, signal amplitude, and the chosen DC operating potential should suit the specimen and electrolyte. Gamry’s coated-panel tutorial explains this setup.
Before-and-after measurements can investigate changes following a defined treatment. For example, Metrohm’s coated-aluminum study compares spectra before and after an electrochemical treatment. Its settings and conclusions belong to that experiment; they are not a universal coating qualification procedure.
Reading spectra and models
Bode and Nyquist plots
A Bode presentation shows impedance magnitude and phase against frequency. A Nyquist presentation plots imaginary against real impedance; check the sign convention on the vertical axis. Retain the frequency information when interpreting either representation. These are complementary views of the same measurement. Gamry explains the two formats.
What fitted parameters mean
Coating models may include solution resistance, coating capacitance, resistance associated with electrolyte-conducting pathways, and interfacial elements. Water uptake can change coating capacitance, which also depends on film thickness, area, and dielectric properties. Consequently, a change needs contextual interpretation. Different circuits can fit the same spectrum, so a good fit alone does not establish a degradation mechanism. Gamry’s fundamentals tutorial discusses these relationships and modeling ambiguities.
Data quality and limitations
Conventional interpretation assumes an approximately linear response and a system that remains sufficiently stable during acquisition. Drift can distort the spectrum, particularly at low frequencies. BioLogic’s stationarity guidance illustrates why changing electrochemical conditions can be mistaken for a physical process.
High-impedance measurements also need attention to electrical interference and instrument capability. ISO 16773-3:2016 addresses checking the measurement arrangement with dummy cells. Such checks support confidence in acquisition; they do not validate every interpretation of a real coating.
Relevant ISO references
As checked on 10 October 2026, ISO’s catalog lists ISO 16773-1:2016 for terminology, Part 2:2016 for data collection, Part 3:2016 for dummy-cell analysis, and Part 4:2017 for example spectra and interpretation guidance. Part 2 explicitly separates acquisition from interpretation. Consult the applicable full standard for procedural requirements; this entry is an introduction.
Practical reporting checklist
Record enough detail for another laboratory to understand the comparison:
- Substrate, preparation, coating system, cure, thickness, and exposed area.
- Electrolyte, temperature, conditioning, and exposure history.
- Electrode arrangement, instrument, frequency range, amplitude convention, and DC potential.
- Raw spectra, repeat measurements, quality checks, and any excluded data.
- Model rationale, fit residuals, parameter units, and interpretation limits.
Frequently asked questions
Does EIS measure adhesion directly?
No. EIS records electrical behavior. An interpretation involving the coating–metal interface requires a justified model and supporting evidence; it does not provide an adhesion-strength measurement.
Can one impedance value determine whether a coating passes?
Only within an appropriately validated test and acceptance framework. Specify the frequency, conditions, units, and comparison basis rather than transferring an isolated cutoff between coating systems.
Does a fitted resistance give the corrosion rate?
Not by itself. Converting polarization resistance to corrosion rate requires additional information, including Tafel constants, as explained in Gamry’s measurement guidance.
At a glance
- Method: Electrochemical impedance spectroscopy
- Typical specimen: Coated metal in electrolyte
- Output: Frequency-resolved impedance spectrum
- Common plots: Bode and Nyquist
- Reference family: ISO 16773
Related reference: corrosion science basics, adhesion testing and dry-film thickness measurement.
Educational reference. Use the applicable full standard, instrument instructions and project specification. Cover: original AI-generated illustration; it does not depict a recorded test.
Educational reference. Coating performance varies by formulation. Always follow the manufacturer’s product data sheet, safety data sheet and your project specification.